Update of the Netherlands’ position as a net contributor to the EU in the period 2020-2023
Supplement to the Court of Audit’s report of 14 October 2020 with figures on the years 2020, 2021, 2022 and 2023.
The Court of Audit published a report on 14 October 2020 concerning the Netherlands’ position as a net contributor to the European Union in the period 2014-2019. The report calculated the net contribution as the difference between payments to and receipts from the EU. It also compared the Netherlands’ position with that of other EU member states.
This factsheet updates the figures to the end of 2023. For a full understanding of the figures and tables, this factsheet should be read in conjunction with the report.
Update: 2020-2023
The years 2020, 2021, 2022 and 2023 have been added to figures 2, 3, 4, 5, 6 and to tables 3, 4, 5 in the report. The data are taken from the European Commission, EU spending and revenue 2021-2027, downloaded on 16 September 2024.
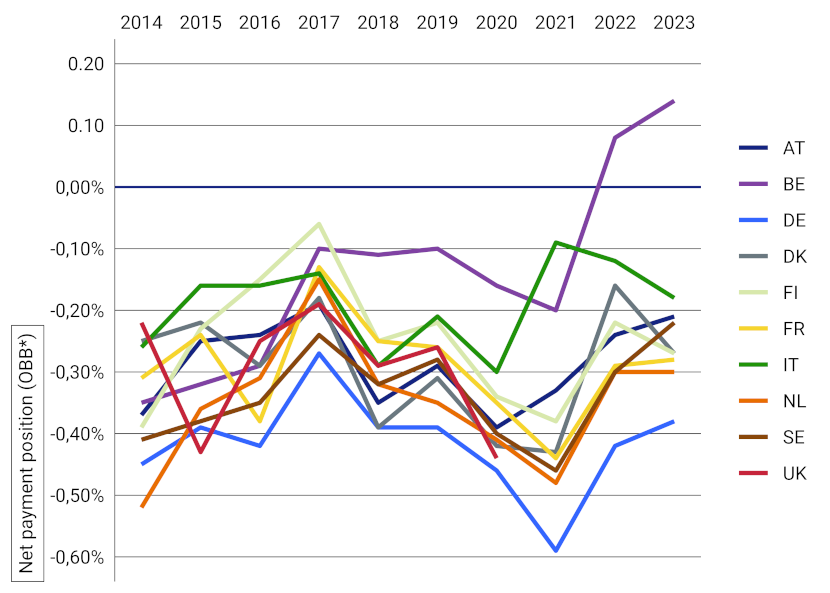
The data on 2021, 2022 and 2023 confirm the picture painted in previous years: according to the Dutch accounting definition, the Netherlands is the largest net contributor and according to the European Commission’s operating budgetary balance (OBB) definition, it ranks among the largest net contributors.
The temporary Next Generation EU recovery plan was introduced alongside the Multiannual Financial Framework in 2021. The plan, the greater part of which consists of the Recovery and Resilience Facility, will provide member states with billions of euros in additional funds to support their stronger and more resilient recovery from the COVID-19 crisis. The Recovery and Resilience Facility is about two-thirds of the size of the EU’s Multiannual Financial Framework (nearly €725 billion).
The analysis below does not include member states’ receipts from Next Generation EU. Their inclusion would prevent comparisons with previous years and with the report the Court of Audit published in 2020, before Next Generation EU was introduced. Inclusion of Next Generation EU payments to the member states (and the member states’ higher contributions to the EU as from 2028) would increase the differences among member states. The amounts and differences in the member states’ receipts are substantial (Italy and Spain, for instance, will together receive 55% of the Recovery and Resilience Fund’s loan commitments and grants). As the Netherlands did not receive funds from the Recovery and Resilience Facility until 2024 and will not contribute to it until some point in the future. Next Generation EU’s influence on the Netherlands’ position as a net contributor in 2023 is accordingly negligible.
The Netherlands’ contributions and receipts are first presented below, followed by the net contribution position.
Figure 1: The Netherlands’ contribution to the EU as a percentage of GNI (2014-2023)
| Year | Retroactive corrections | Customs duties | Lump sum | GNI-based contribution | VAT-based contribution | Plastic-based contribution |
|---|---|---|---|---|---|---|
| 2014 | -0,15% | 0,32% | 0,00% | 0,84% | 0,12% | NA |
| 2015 | -0,15% | 0,34% | 0,00% | 0,74% | 0,11% | NA |
| 2016 | 0,00% | 0,35% | -0,10% | 0,67% | 0,06% | NA |
| 2017 | 0,00% | 0,34% | -0,10% | 0,50% | 0,06% | NA |
| 2018 | 0,00% | 0,32% | -0,09% | 0,65% | 0,06% | NA |
| 2019 | 0,00% | 0,33% | -0,09% | 0,68% | 0,06% | NA |
| 2020 | 0,00% | 0,40% | -0,09% | 0,77% | 0,06% | NA |
| 2021 | 0,00% | 0,35% | -0,17% | 0,81% | 0,12% | 0,02% |
| 2022 | 0,00% | 0,41% | -0,17% | 0,68% | 0,14% | 0,02% |
| 2023 | -0,02% | 0,32% | -0,16% | 0,59% | 0,14% | 0,02% |
The Netherlands' contributions to the EU vary from year to year.
Table 1: The Netherlands’ contributions to the EU in millions of euros and as a percentage of GNI
| Contributions | 2014 | 2015 | 2016 | 2017 | 2018 |
|---|---|---|---|---|---|
| in m€ | 7,475.3 | 7,045.7 | 6,717.2 | 5,848.7 | 7,347.7 |
| as % of GNI | 1.13 | 1.04 | 0.98 | 0.80 | 0.94 |
| 2019 | 2020 | 2021 | 2022 | 2023 | |
| in m€ | 8,055.1 | 9,021.3 | 9,601.5 | 9,806.1 | 9,231.4 |
| as % of GNI | 0.99 | 1.14 | 1.12 | 1.08 | 0.90 |
Figure 2: The Netherlands’ receipts from the EU (2014-2020)

The Netherlands’ receipts from the EU budget have been increasing since 2016.
This figure relates to the period 2014-2020. Information on receipts in 2021-2023 are not presented in the figure because the categories for 2021-2027 differ from those for 2014-2020. Valid comparisons therefore cannot be made.
Table 2: The Netherlands’ receipts from the EU in millions of euros and as a percentage of GNI
| Total receipts | 2014 | 2015 | 2016 | 2017 | 2018 |
|---|---|---|---|---|---|
| in millions of euros | 2,014.4 | 2,359.2 | 2,289.0 | 2,417.2 | 2,464.31 |
|
As a percentage of GNI |
0.30 | 0.35 | 0.33 | 0.33 | 0.32 |
| 2019 | 2020 | 2021 | 2022 | 2023 | |
| in miljoenen € | 2,557.1 | 2,735.2 | 2,624.4 | 3,510.82 | 2,886.2 |
| in % bni | 0.31 | 0.35 | 0.31 | 0.39 | 0.28 |
1 The European Commission has retrospectively adjusted the figures for 2018. This amount therefore differs from the amount stated in our report.
2 The higher contribution in 2022 was due principally to receipts from the Brexit Adjustment Reserve.
Figure 3: The Netherlands’ net payment position as a percentage of GNI under both definitions (2014-2023)
| Definition | Accounting definition | Operating budgetary balance |
|---|---|---|
| 2014 | -0,82 | -0,52 |
| 2015 | -0,69 | -0,36 |
| 2016 | -0,64 | -0,31 |
| 2017 | -0,47 | -0,15 |
| 2018 | -0,62 | -0,32 |
| 2019 | -0,67 | -0,35 |
| 2020 | -0,8 | -0,41 |
| 2021 | -0,82 | -0,48 |
| 2022 | -0,7 | -0,3 |
| 2023 | -0,62 | -0,3 |
The Netherlands’ net contribution position is higher when based on the accounting definition than when based on the operating budgetary balance definition.
Table 3: The Netherlands’ net payment position under the two definitions in millions of euros
| Definition | 2014 | 2015 | 2016 | 2017 | 20183 |
|---|---|---|---|---|---|
| Net payment position operating budgetary balance | -3,461.1 | -2,451.2 | -2,158.5 | -1,082.9 | -2,474.3 |
| Net payment position accounting definition | -5,460.9 | -4,686.5 | -4,428.1 | -3.431.4 | -4,883.3 |
| 2019 | 2020 | 2021 | 2022 | 2023 | |
| Net payment position operating budgetary balance | -2,870.9 | -3,202.0 | -4,113.9 | -2,686.6 | -3,119.0 |
| Net payment position accounting definition | -5,498.0 | -6,286.1 | -6.977,1 | -6,295.3 | -6,345.3 |
3 The European Commission has retrospectively adjusted the figures for 2018. The amount in this column therefore differs from the amount stated in our report.
Figure 4: Net position of 10 net contributors as a percentage of GNI under the OBB definition (2014-2023)

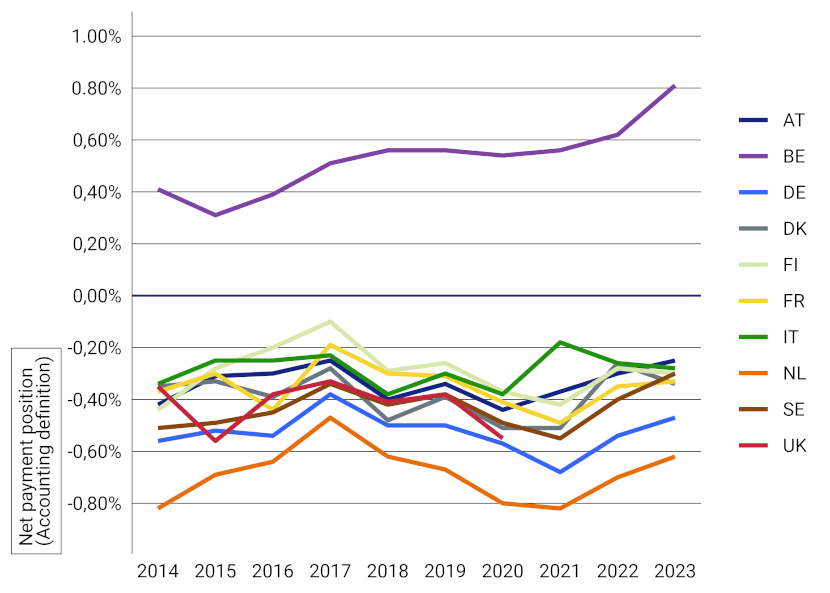
Figure 5: Net position of 10 net contributors as a percentage of GNI under the accounting definition (2014-2023)

Under the accounting definition, the Netherlands has been the biggest contributor throughout the entire period. Under his definition, Belgium becomes a net recipient.
Last updated in December 2024, situation in October 2024